Data <- read.table("Data.csv", header=T, sep=",")
boxplot(X2 ~ X1, data=Data, xlab="X1", ylab="X2", outline=T) # If the last T is F, no outliers are drawn
In R, simple graphs are easy to use. It can't be elaborate, but it's useful when you want to make a graph for the time being.
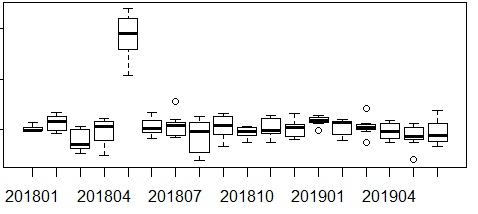
To wirte Box Plot.
If you name the sample data "Data.csv" and put it in the folder "Rtest" on the C drive, you will get a graph like the one below.
setwd("C:/Rtest")
Data <- read.table("Data.csv", header=T, sep=",")
boxplot(X2 ~ X1, data=Data, xlab="X1", ylab="X2", outline=T) # If the last T is F, no outliers are drawn
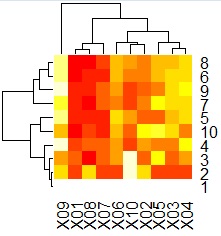
To wirte Heat Map.
If you name the sample data "Data.csv" and place it in the folder "Rtest" on the C drive, you will get a graph like the one below.
* The graph is the top and bottom of the original table.
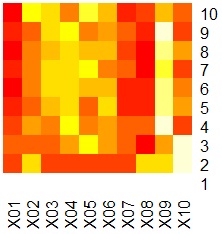
setwd("C:/Rtest")
Data <- read.csv("Data.csv", header=T)
DataM <- as.matrix(Data)
heatmap(DataM, Colv = NA, Rowv = NA, scale="none")
By the way, if you simply make the last line a
heatmap(DataM, scale="none")
, it will do a cluster analysis .